

What is a Dashboard?
A dashboard is a tool that presents all management KPIs (key performance indicators) and critical data points at a single place that helps in monitoring the health of the business or department. The dashboard simplifies the complex data sets by making use of data visualization, which in turn helps users to gain awareness of the current performance at a glance. The user can visualize data in the form of charts, graphs, or maps.
The dashboard becomes tremendously valuable for planned decision-making. The dashboard system helps in turning these data into actionable insights and reports that you will find it easy to read. Today, dashboards are a proven system for businesses as it helps them to consume the big data clearly so as to make fact-based decisions. Business users need not rely on their mere gut instincts!
It would be great to use dashboard software to make out how well the marketing plan and business project is performing. Let’s discuss dashboard software in detail.
What is Dashboard Software?
Dashboard software works like a computerized tool that simplifies complex data sets and helps in revealing the patterns of the data processing. It allows users to monitor business performance at a glance.
You can make use of this technology in various types of business processes such as marketing, human resource, sales, and production.
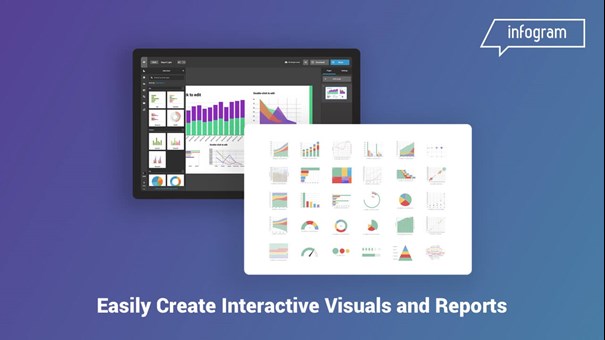
1. Infogram
Infogram is a data visualization company that helps people create charts, infographics, maps, and reports. We show people how to communicate with data in a clear and engaging way. We serve a wide range of customers including marketers, educators, journalists, consultants, and business professionals. We support people who see data as a powerful communication tool when visualized effectively. Our users have created over 4.8 million infographics and charts that are viewed by over 50 million people every month.
Deployment
- Cloud Hosted
Data Visualization Software Features
- Dashboard
- Data Import/Export
- Data Management
- Data Mining
- Filtered Views
- OLAP
- Relational Display
- Reporting & Analytics
- Simulation Models
- Visual Discovery
Devices Supported
- Windows
- Mac
- Android
- iPhone/iPad
- Linux
- Web-based
Pricing Model
- Monthly Payment
- Annual Subscription
- Quote Based
- One-Time Payment
- Free
Resources
- Help Guides
- Video Guides
- Blogs
- Webinars
- Infographics
- Case Studies
- Whitepapers
- On-Site Training
Support
- Phone
- Live Chat
- Online (Ticket)
- Business Hours
Business Size
- Small
- Medium
- Large
- Freelancer
2. Datapine
Datapine helps people to turn data into actionable insights and make data-driven decisions in real-time. A user-friendly drag & drop interface empowers everyone to make sense of complex data by asking important questions and receiving answers immediately. It offers a wealth of innovative BI 4.0 features like intelligent alarms and interactive dashboard features for modern, KPI-driven businesses.
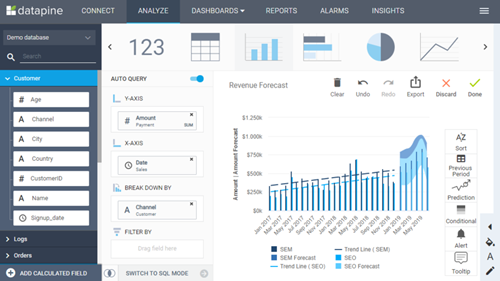
It is easy to lose track of what really matters when you monitor plenty of KPIs and manage a lot of dashboards. datapine's business alerts are here to help you out with that: as soon as a pre-defined goal is met, or whenever an unexpected event happens, you will be notified and keep full control of what drives your business. Based on artificial intelligence, our data alerts learn from trends and patterns and let you know as soon as something important happens.
Data Visualization Software Features
- Dashboard
- Data Import/Export
- Data Management
- Data Mining
- Filtered Views
- Relational Display
- Reporting & Analytics
- Visual Discovery
- Simulation Models
Business Intelligence Software Features
- Ad Hoc Analysis
- Benchmarking
- Budgeting & Forecasting
- Dashboard
- Data Sharing
- Data Visualization
- Key Performance Indicators
- Predictive Analytics
- Profitability Analysis
- Strategic Planning
- Trend/Problem Indicators
- Workflow Collaboration
Dashboard Software Features
- Alerts/Notifications
- Dashboard Templates
- Data Filtration
- Data Integration
- Dynamic Images
- Embedded Analytics
- KPI Monitoring
- Timeframe Comparison
- Widgets
Deployment
- Cloud Hosted
Devices Supported
- Windows
- Mac
- Linux
- Android
- iPhone/iPad
- Web-based
Pricing Model
- Annual Subscription
Business Size
- Medium
- Large
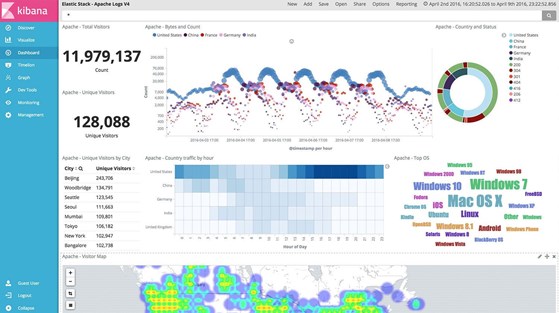
3. Kibana
Kibana lets you visualize your Elasticsearch data and navigate the Elastic Stack, so you can do anything from learning why you're getting paged at 2:00 a.m. to understanding the impact rain might have on your quarterly numbers. Kibana gives you the freedom to select the way you give shape to your data. And you don’t always have to know what you're looking for. With its interactive visualizations, start with one question and see where it leads you.
Data Visualization Software Features
- Data Mining
- Filtered Views
- Relational Display
- Dashboard
- Data Import/Export
- Data Management
- OLAP
- Reporting & Analytics
- Simulation Models
- Visual Discovery
Deployment
- Open API
- Cloud Hosted
- On-Premise
Devices Supported
- Windows
- Mac
- Linux
- Android
- iPhone/iPad
- Web-based
Pricing Model
- Free
- Monthly Payment
- Annual Subscription
- Quote Based
- One-Time Payment
Resources
- Help Guides
- Blogs
- Video Guides
- Webinars
- Infographics
- Case Studies
- Whitepapers
- On-Site Training
Support
- Phone
- Live Chat
- Online (Ticket)
- Business Hours
Business Size
- Small
- Medium
- Large
- Freelancer
4. QlikView
QlikView allows users to rapidly build and deploy analytic apps without the need for professional development skills, driving faster response to change business requirements, shorter time to value, and more insight across the organization.
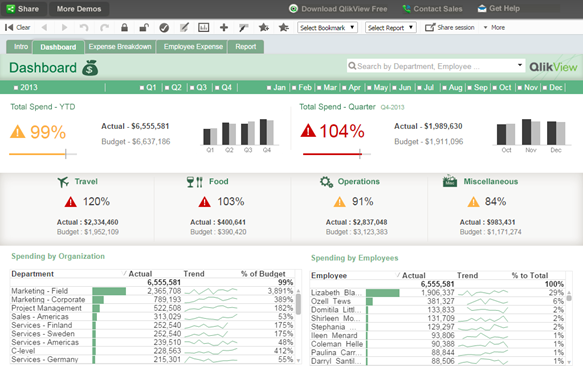
The modern analytics era truly began with the launch of QlikView, our classic analytics solution, and the game-changing Associative engine it is built on. It revolutionized the way organizations use data with the intuitive visual discovery that put business intelligence in the hands of more people than ever. And we continue to lead the way with Qlik Sense, our next-generation analytics platform. With the Associative Engine, powerful augmented analytics, and a governed multi-cloud architecture, it supports the full range of analytics use cases at an enterprise scale.
Data Visualization Software Features
- Data Mining
- Dashboard
- Data Import/Export
- Data Management
- Filtered Views
- OLAP
- Relational Display
- Reporting & Analytics
- Simulation Models
- Visual Discovery
Business Intelligence Software Features
- Key Performance Indicators
- Trend/Problem Indicators
- Ad Hoc Analysis
- Benchmarking
- Budgeting & Forecasting
- Dashboard
- Data Sharing
- Data Visualization
- Predictive Analytics
- Profitability Analysis
- Strategic Planning
- Workflow Collaboration
Deployment
- Cloud Hosted
- Open API
- On-Premise
Devices Supported
- Windows
- Mac
- iPhone/iPad
- Web-based
- Linux
- Android
Pricing Model
- Annual Subscription
- Quote Based
- Free
- Monthly Payment
- One-Time Payment
Resources
- Help Guides
- Blogs
- Whitepapers
- Video Guides
- Webinars
- Infographics
- Case Studies
- On-Site Training
Support
- Phone
- Online (Ticket)
- Live Chat
- Business Hours
Business Size
- Small
- Medium
- Large
- Freelancer
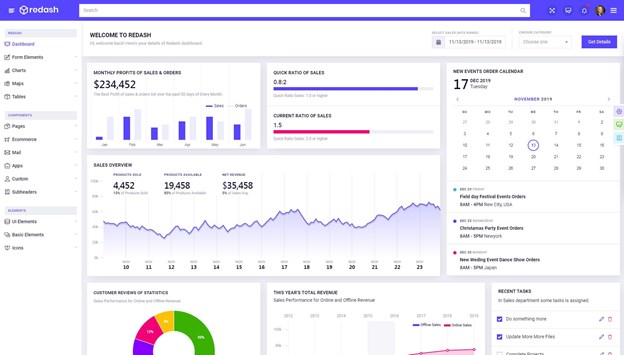
5. Redash
Connect and query your data sources, build dashboards to visualize data, and share them with your company. Redash helps you make sense of your data and connect and query your data sources, build dashboards to visualize data and share them with your company.
Dashboard Software Features
- Dashboard Templates
- Alerts/Notifications
- Data Filtration
- Data Integration
- Dynamic Images
- Embedded Analytics
- KPI Monitoring
- Timeframe Comparison
- Visual Representation
- Widgets
Business Intelligence Software Features
- Dashboard
- Data Sharing
- Data Visualization
- Key Performance Indicators
- Predictive Analytics
- Workflow Collaboration
- Ad Hoc Analysis
- Benchmarking
- Budgeting & Forecasting
- Profitability Analysis
- Strategic Planning
- Trend/Problem Indicators
Deployment
- Cloud Hosted
- Open API
- On-Premise
Devices Supported
- Linux
- Web-based
- Windows
- Mac
- Android
- iPhone/iPad
Pricing Model
- Monthly Payment
- Annual Subscription
- Quote Based
- One-Time Payment
- Free
Resources
- Help Guides
- Case Studies
- On-Site Training
- Video Guides
- Blogs
- Webinars
- Infographics
- Whitepapers
Support
- Online (Ticket)
- Phone
- Live Chat
- Business Hours
Business Size
- Small
- Medium
- Large
- Freelancer
6. Databox
Databox pulls all your data into one place, so you can track performance and discover insights in real-time. Databox is ranked #1 as the most usable data visualization tool by G2Crowd. We’ve built deep integrations with 70+ popular tools, created 200+ report templates, and built thousands of pre-built metric visualizations for them. All so you can quickly visualize your data without any coding, data manipulation, or design-work required.
If you need a performance update, you shouldn’t have to log in to dozens of tools to check on marketing, sales, support, etc. With Databox, track metrics from multiple sources in one dashboard so you can easily draw a correlation, identify trends, and make adjustments in real-time. All things that would take you hours or days to do when performance lives inside each individual tool.
Reporting Software Features
- Automated Reports
- Data Source Connectors
- Drill Down
- Financial Reports
- Marketing Reports
- Report Export
- Sales Reports
- Visual Analysis
- Customizable Dashboard
- Drag & Drop
- Forecasting
- OLAP
Deployment
- Cloud Hosted
- Open API
- On-Premise
Devices Supported
- Windows
- Mac
- Android
- iPhone/iPad
- Web-based
- Linux
Pricing Model
- Monthly Payment
- Annual Subscription
- Free
- Quote Based
- One-Time Payment
Resources
- Help Guides
- Video Guides
- Blogs
- Case Studies
- On-Site Training
- Webinars
- Infographics
- Whitepapers
Support
- Online (Ticket)
- Phone
- Live Chat
- Business Hours
Business Size
- Small
- Medium
- Large
- Freelancer


Comments